

Nomura Holdings has reported its earnings results for the second quarter and first half of FY2026/27. In the first half, net income rose 27% YoY to Y249.3bn and annualized ROE came to 13.3%.
In the second quarter, net income was Y103.7bn and annualized ROE was 10.9%. The half-year dividend came to Y35 per share.
*First half refers to Apr–Sep 2026 and second quarter refers to Jul–Sep 2026. Net revenue is revenue less interest expenses and net income is net income attributable to Nomura Holdings shareholders.
- 1H: Net income rose 27% YoY. All divisions contributed to the growth, and four-segment income before income taxes rose 50%. Ability to generate earnings improved sharply.
- 2Q: Net income fell 29% QoQ. Revenue and income before income taxes fell QoQ but held firm.
- Half-year dividend: Y35 per share, representing an increase of Y8 YoY.
Nomura Holdings’ FY2026/27 half-year dividend is Y35 per share, an increase of Y8 from Y27 a year earlier.
|
Source: Nomura Holdings “Nomura Declares Half Year Dividend”, “NOMURA HOLDINGS, INC. Financial Summary–Six months ended September 30, 2026”
In the first half of the fiscal year, both net revenue and income before income taxes rose YoY.
|
1. Diluted net income (loss) attributable to Nomura Holdings shareholders per share
2. Calculated using annualized net income attributable to Nomura Holdings shareholders for each period.
All business divisions delivered a strong first-half performance, with four segment income before income taxes up 50%. Ability to generate earnings improved sharply over the past year.
The stable revenue base has steadily been getting stronger, reflecting expanded asset management-based business. Stable revenues grew about 60% YoY.
ROE came to 13.3%, a steady improvement from 11.3% a year earlier, reflecting the benefits of structural reforms.
In the second quarter of the fiscal year, both net revenue and income before income taxes fell QoQ.
|
Net revenue, income before income taxes, and net income fell QoQ, but earnings have remained solid even under uncertain market environment.
Source: Nomura Holdings “Consolidated Results of Operations Second quarter, year ending March 2027 (US GAAP)” p.3
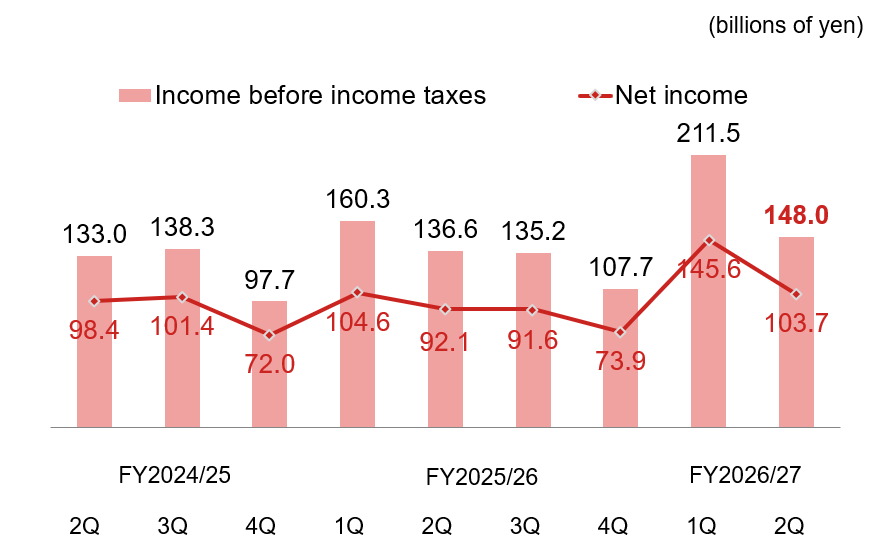
3. Net income attributable to Nomura Holdings shareholders.
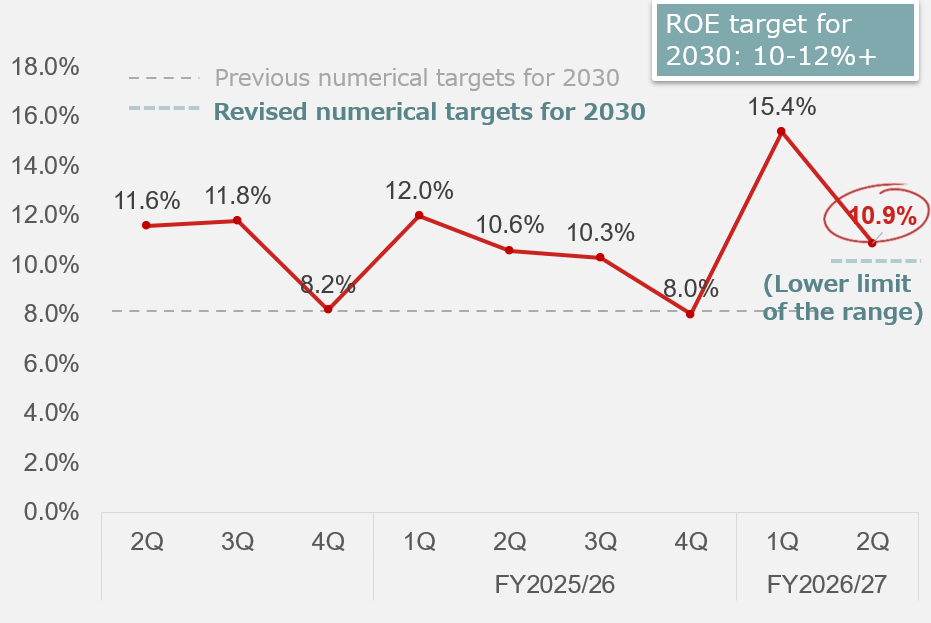
Second-quarter annualized ROE came to 10.9%, meeting our 2030 Vision for ROE of 10% to 12% or more.
*Quarterly ROE is an indicator using annualized quarterly net income attributable to Nomura Holdings shareholders. 1H cumulative annualized ROE is based on a different period.
Source: Nomura Holdings “Consolidated Results of Operations Second quarter, year ending March 2027 (US GAAP)” p.3
Business segment results.
|
|||||||||||||||||||||||||||||||||||||||||||||||||
*Difference between four segment subtotal and consolidated figures is attributable to the “other” division and adjustments presented in published materials.
Both net revenue and income before income taxes fell QoQ, but earnings remained at a high level despite uncertain market conditions owing to progress with asset management business. Inflows into assets for the purpose of longer-term holdings increased as investment diversification based on portfolio management gained traction. As a result, net inflows of recurring revenue assets and recurring revenue both achieved all-time highs.
- Net inflows of recurring revenue assets: Y755.4bn
- Recurring revenue: Y66.7bn
- Recurring revenue cost coverage ratio: 79%
Source: Nomura Holdings “Consolidated Results of Operations Second quarter, year ending March 2027 (US GAAP)” p.8~10
Business revenue fell QoQ from the record-high level achieved in the previous quarter, but asset management fees were solid. Net revenue and income before income taxes both declined QoQ as investment gain/loss fell and one-time expenses related to business integration arose, but term-end AuM remained high and inflows were solid.
- Assets under management (net): Y152.8trn (FY26/27 2Q)
- Net inflows: Y478.0bn (FY26/27 2Q)
Source: Nomura Holdings “Consolidated Results of Operations Second quarter, year ending March 2027 (US GAAP)” p.11~12
Global Markets’ net revenue slowed compared to the record-high level4 recorded in the previous quarter, but Equities’ net revenue remained at elevated levels. Investment Banking net revenue rose for key products, such as Advisory, Financing, and Solutions. Division-wide net revenue and income before income taxes fell QoQ, but business-related expenses declined, and expenses were held in check owing to sustained cost controls.
- Net revenue by Global Markets: Y254.2bn
- Net revenue by Investment Banking: Y54.7bn
Source: Nomura Holdings “Consolidated Results of Operations Second quarter, year ending March 2027 (US GAAP)” p.13~15
4. A record since comparisons possible in FY2016/17
Net revenue and income before income taxes grew QoQ on solid revenue from lending activities and trust and agent services owing to growth in loans outstanding, investment trust balances, and assets under administration as well as an increase in market interest rates. Deposit sweep service contracts and balances grew steadily, boosting the client base and deposit procurement capabilities.
- Loans outstanding: Y1,361bn (FY26/27 Sep, Nomura Trust and Banking)
- Investment trust balance: Y44.2trn (FY26/27 Sep, Nomura Trust and Banking)
- Assets under administration: USD73.7bn (FY26/27 Sep, Nomura Bank Luxembourg)
Source: Nomura Holdings “Consolidated Results of Operations Second quarter, year ending March 2027 (US GAAP)” p.16~17
-
How were Nomura Holdings’ 2Q FY2026/27 financial results?
In the first half of FY2026/27, net revenue and income before income taxes rose YoY. In the second quarter, net revenue and income before income taxes fell QoQ amid uncertain market conditions, but earnings remained solid.
-
What is the half-year dividend? Is it higher than last year’s half year dividend?
Nomura reported a half-year dividend of Y35 per share for FY2026/27. This is up Y8 from the prior year’s half-year dividend of Y27 per share. The payment date is scheduled for December 1, 2026. No guidance for the year-end dividend is available.
-
How well did ROE do compared to the longer-term vision?
Nomura reported annualized first-half ROE of 13.3% and second-quarter annualized ROE of 10.9%. Steady progress was made toward achieving the 2030 management vision of ROE of 10% to 12% or more.
Access press releases and financial results below.
This article is a summarized version of the documents shown in the Related Links.
Definitions (EPS calculation method, ROE annualization method, etc.) follow those in the PDF document.
Due to fractions, some figures shown in this article may not match actual calculations.
Date: October 29, 2026
Applicable period:
- FY2026/27 1H: April 1, 2026 to September 30, 2026
- FY2026/27 2Q: July 1, 2026 to September 30, 2026
Nomura Holdings IR Department
+81(3)5255-1000