


Have you ever wondered why market indices and your own holdings don’t always move in the same direction?
The Nikkei Stock Average, the Tokyo Stock Price Index (TOPIX), the S&P 500, and the Dow Jones Industrial Average are stock indices that measure the performance of equity markets. Similarly, bond indices track the performance of bond markets, including government bonds, municipal bonds, and corporate bonds.
In March 2025, Nomura Fiduciary Research & Consulting (NFRC)’s dedicated index team, jointly developed the Yomiuri Stock Price Index (Yomiuri 333) with The Yomiuri Shimbun, offering a fresh perspective on Japanese equities. In this two-part series, we take a closer look at indices. In Part 1, the team explains the basics of stock indices and why we need more than one.
Featured speakers
- 拡大
- Hiroaki Yamagishi
Senior Quantitative Analyst
Head of Index Branding Group
Index Services Department
Nomura Fiduciary Research & Consulting

- 拡大
- Matsunami
Quantitative Analyst
Index Services Department
Nomura Fiduciary Research & Consulting
Q. NFRC creates many indices, including the Yomiuri 333. What exactly is a stock index?
A stock index is a single number that summarizes daily stock price movements based on a set of rules. For example, the S&P 500, one of the most widely followed stock indices in the United States, selects 500 major U.S. companies and turns their daily price movements into a numerical indicator using its own methodology.
The Dow Jones Industrial Average, which began in 1896, is generally considered to be the world’s first stock index. It was created by Dow Jones & Company, a U.S. publisher and newswire service, to communicate market movements to readers.
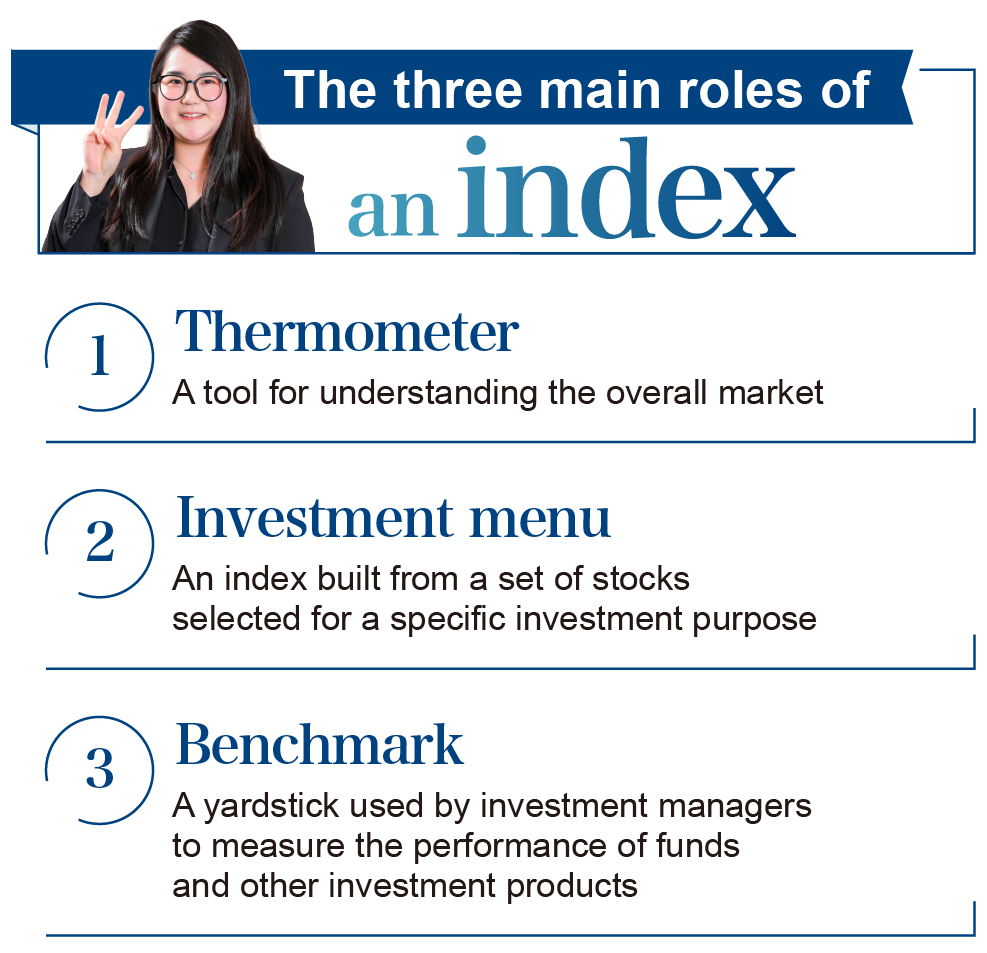
Indices are like the thermometer of the market. Just as daily temperature readings help us understand seasonal changes, indices help us see how the market changes over time. If the place or time of measurement changed every day, it would be difficult to spot the trend.
Stock indices work in the same way. By tracking numbers based on set rules, we can understand the current condition of the market and its direction. Each index provider sets its own calculation rules for daily index values.
Q. What kinds of calculation methods are there?
There are three main calculation methods. The first is the price-weighted method, also used in the Nikkei Stock Average, which adds up the share price of selected stocks and calculates their average. The second is the market capitalization-weighted method, also used in TOPIX, where each constituent stock’s influence depends on its market capitalization. The third is the equal-weighted method, which assumes all stocks are invested in equally.
Although the Nikkei Stock Average and TOPIX are both Japanese indices, they do not always move in the same way. One reason the Nikkei Average may rise while your own stocks fall is that they include different stocks and are calculated in different ways, so they can move differently.

Price-weighted indices
Examples: Nikkei Average, Dow Jones Industrial Average
Calculation: The sum of the share prices of the selected constituents is divided by a divisor.
Characteristics: These indices are often composed of representative companies in the market, making it easy to intuitively understand the price movements of prominent stocks. However, higher-priced stocks tend to have a greater impact on the index.
Market capitalization-weighted indices
Examples: TOPIX, S&P 500
Calculation: The daily market capitalizations of the selected constituents are added together and compared with the market capitalization on the base date.
Characteristics: These indices take market capitalization into account, making it easier to capture movements that reflect the relative size of companies in the overall market. However, large-cap stocks tend to have a greater impact on the index.
Equal-weighted indices
Example: Yomiuri 333
Calculation: The average is calculated as if all selected constituents were held in equal amounts.
Characteristics: These indices reflect the performance of each constituent more evenly, including mid-cap stocks. However, they are less influenced by company size.
To explain the Nikkei Average and TOPIX in a little more detail: the Nikkei Average is basically a simple average of the stock prices of 225 selected companies. Because it is a simple average, it is more easily influenced by high-priced stocks, such as Fast Retailing, whose share price is much higher than that of lower-priced stocks.
TOPIX, by contrast, is based on the total market capitalization of listed companies, so it is more affected by the ups and downs of large-cap companies such as Toyota Motor. In that sense, it places greater emphasis on company size.
The Yomiuri 333 is an equal-weighted index that assumes all constituent stocks are held in equal amounts. Because it is less concentrated in large-cap or high-priced stocks, it can more easily capture the overall movement of the selected constituents.
Beyond differences in calculation methods, many indices today are also designed to focus on specific sectors or themes. As a result, the number of indices available for Japanese equities alone is now quite large.
Q. Why create so many different indices?
Because each index has a different role and purpose. For example, the Nikkei Stock Average, which was created by Nikkei Inc., is widely used in the media as an indicator of the Japanese stock market—almost like a “thermometer” for the Japanese economy. TOPIX, meanwhile, is a representative index that reflects the overall movement of the Tokyo Stock Exchange and helps to show trends among stocks listed on the TSE.
In addition, there is now a wide variety of indices designed to match different investment needs—whether for investors looking to invest in large-cap companies, those focusing on specific industries such as automobiles, or those considering high-dividend stocks. This also reflects the history of the market. In the 1970s, index funds were created, linking indices—once seen mainly as market thermometers— with financial products. From that point on, indices were developed with more specific investment goals, using a narrower range of stocks.
Indices are also used as benchmarks, or yardsticks, for measuring the performance of investment managers. For example, if you look at a mutual fund’s prospectus or performance report, you will often see the fund’s performance compared with a benchmark such as TOPIX. This makes it easier to evaluate the fund’s performance and helps investors understand results objectively, whether the fund outperformed or underperformed.
- 拡大
- The three main roles of an index
While no one can predict the future, indices have accumulated over 30 or 40 years of data, making it possible to see how markets behaved during events such as Black Monday or the COVID-19 pandemic. By using historical data to understand risk, investors can examine an index’s performance characteristics—essentially how its prices tend to move—before investing. This can help them prepare in advance.
Having multiple indices encourages healthy competition. If there was only one index, investors would have no choice. But with multiple options, they can choose what suits them best, and this naturally creates competition among index providers. Providers are then encouraged to think about how to design indices with greater transparency, better alignment with current investor needs, and stronger overall quality. I believe this kind of healthy competition also helps the market as a whole.

Q. Are new indices created because there is demand for them?
Yes. Exchange-traded funds (ETFs), which have become increasingly popular as investment vehicles, are mutual funds that can be bought and sold on stock exchanges like individual shares. Thematic indices fit well with this structure. Today, many indices have been developed around specific themes, such as AI-related stocks, semiconductor stocks, and ESG themes.
Index funds and ETFs track a specific index, and the underlying index itself is simply a number calculated based on predetermined rules. However, unlike indices that function mainly as thermometers, thematic indices are more like an investment blueprint—or even an investment menu—because they combine stocks around a specific theme for people who want, for example, to invest in promising AI companies.
Q. Looking at it broadly, what role do indices play in financial markets?
Looking at markets as a whole, indices are indispensable. Looking at just one company does not tell us enough, and it is not realistic to track every stock directly. In that sense, indices are the first step in drawing a picture of the market. They help us understand what the Japanese market looks like right now.
Researchers can use indices to analyze the characteristics of domestic stocks, and they also contribute to the development of new investment products. I believe indices are both financial infrastructure and data infrastructure. They are very important.
We want the indices we create to become more widely recognized and to compete alongside well-known indices in a healthy way.