


Nomura Holdings has reported its earnings results for the fourth quarter of FY2025/26 and for the full fiscal year. Full-year income before income taxes came to Y539.8bn, net income came to Y362.1bn, and ROE came to 10.1%, in all cases marking record highs for the second year in a row. Wealth Management and Wholesale drove companywide performance as our longer-term initiatives bore fruit, showing up as increased stable revenues and diversified revenue sources.
Below, we highlight key elements of our full-year and 4Q financial results and provide a straightforward rundown of our performance by segment as well as specifics on dividends and other shareholder returns.
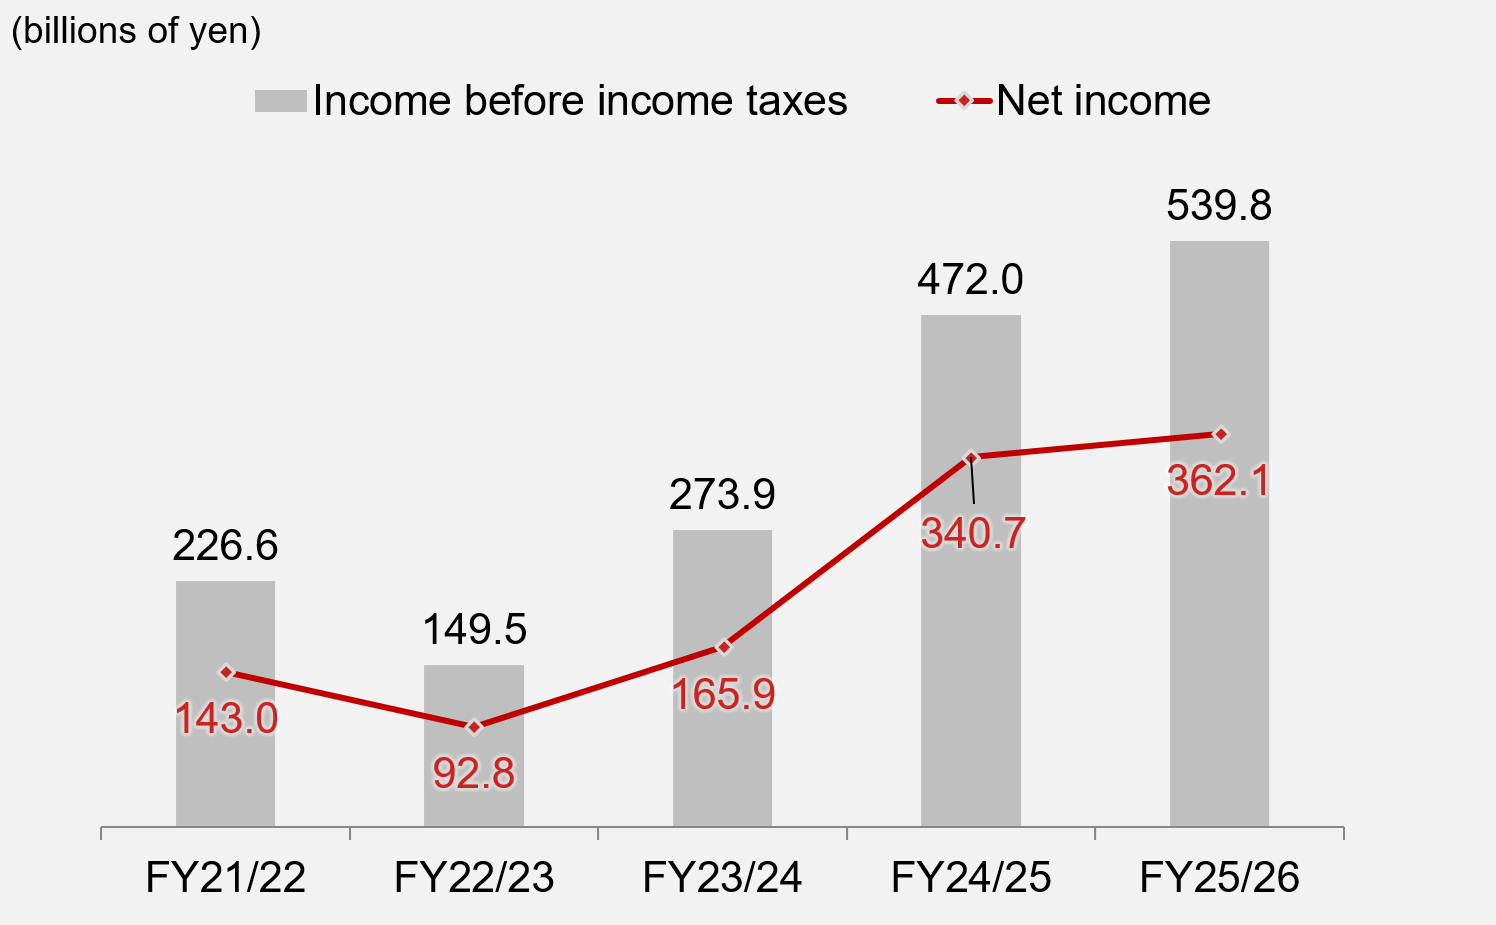
For the full year FY2025/26, net revenue came to Y2,167.7bn, income before income taxes came to Y539.8bn, and net income came to Y362.1bn. ROE, at 10.1%, met our 2030 quantitative target range of 8-10% or more for the second year in a row.
In Wealth Management, recurring revenue business (areas of business that generate stable revenues) gained further momentum. The Wholesale division achieved record-high net revenue, not just in the division as a whole but also in Global Markets and Investment Banking taken separately. In both Wealth Management and Wholesale, income before income taxes climbed to the highest level recorded since each division was established in its present form, driving companywide performance.
|
Full-year income before income taxes and net income
Solid performance in full-year earnings
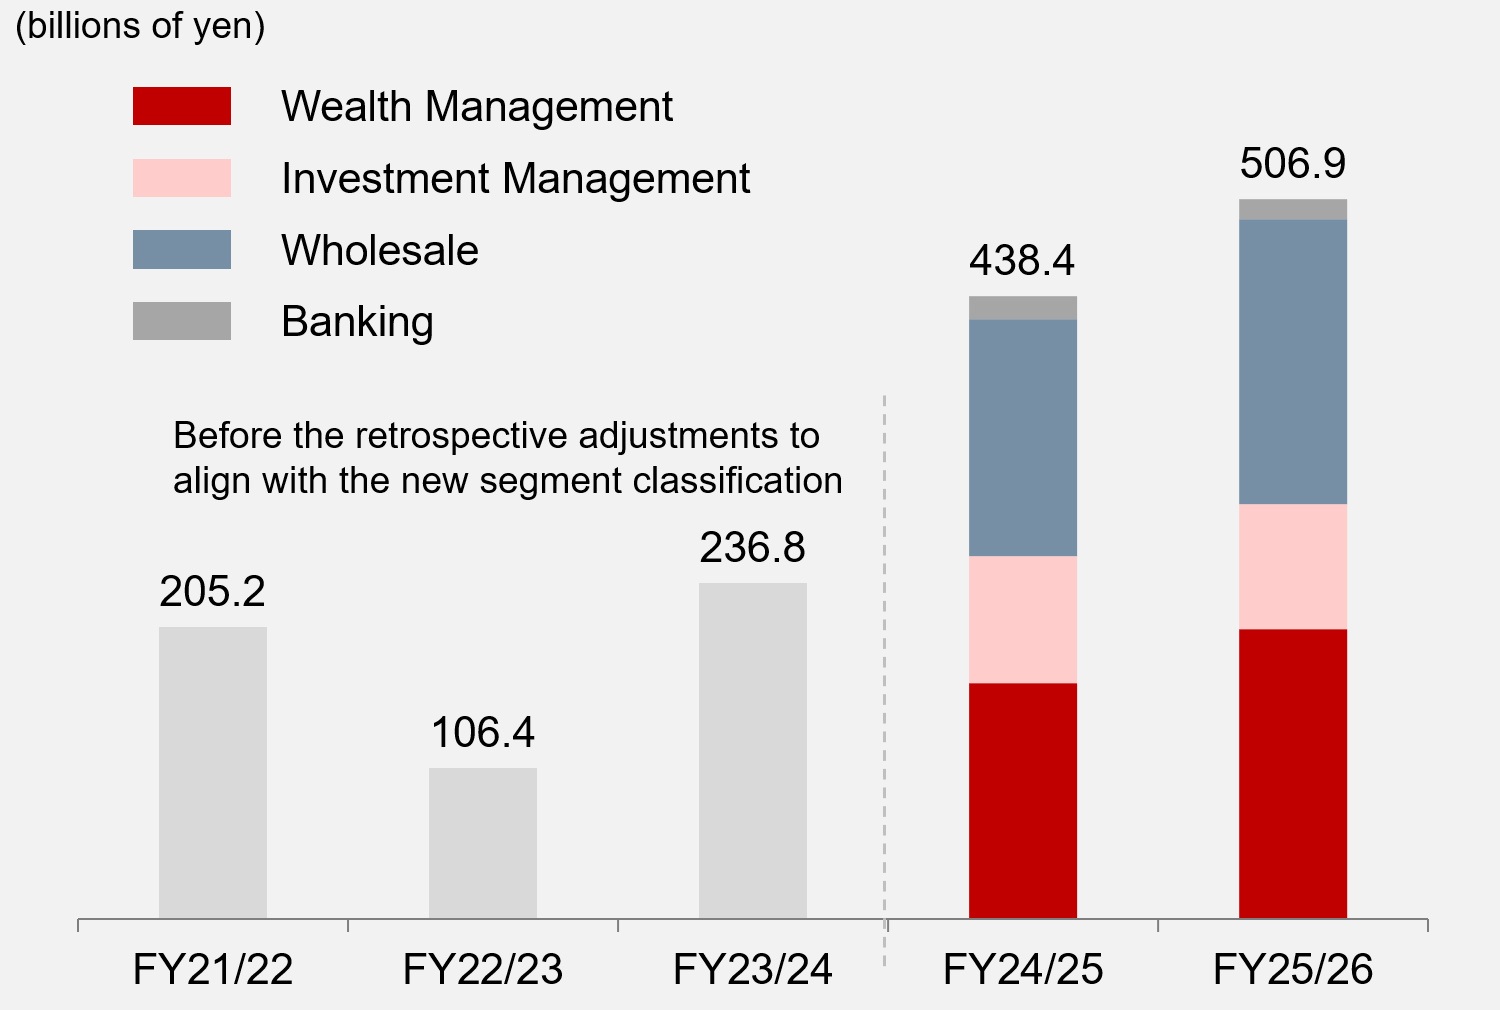
Four-segment total income before income taxes
Companywide performance underpinned by profit growth across four main segments
We expect to pay a year-end dividend of Y24 per share with March 31, 2026, as the date of record, which brings the annual dividend to Y51 per share, for a dividend payout ratio of 41%.
Our aim is to channel our solid earnings performance into enhanced shareholder returns and improved capital efficiency while striking a healthy balance with investments in growth.
|
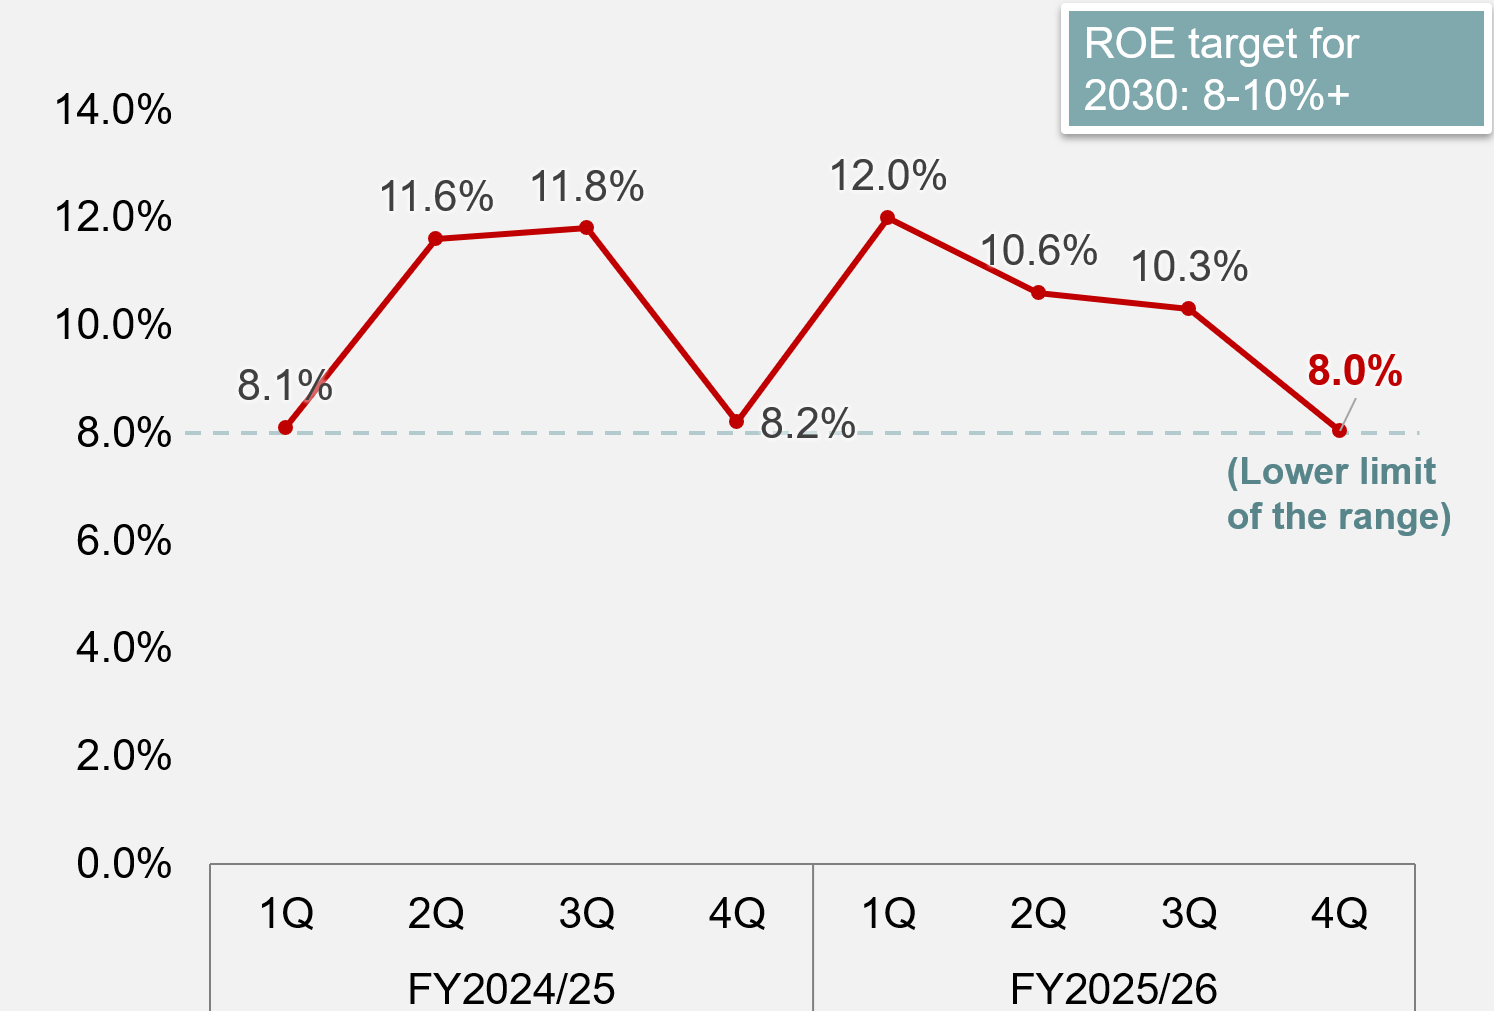
For the fourth quarter of FY2025/26 (January 1, 2026 through March 31, 2026), net revenue came to Y577.2bn, income before income taxes came to Y107.7bn, and net income came to Y73.9bn. ROE, at 8.0%, fulfilled our 2030 quantitative target range of 8-10% or more for an eighth consecutive quarter.
We saw steady progress in our efforts to make our companywide earnings more reliably stable, with solid performance in all main business segments and a continued accumulation of stable sources of revenue. Net income nevertheless declined QoQ, owing to a decline in recognized earnings from affiliated companies.
|
ROE by quarter
2030 target reached for eighth consecutive quarter
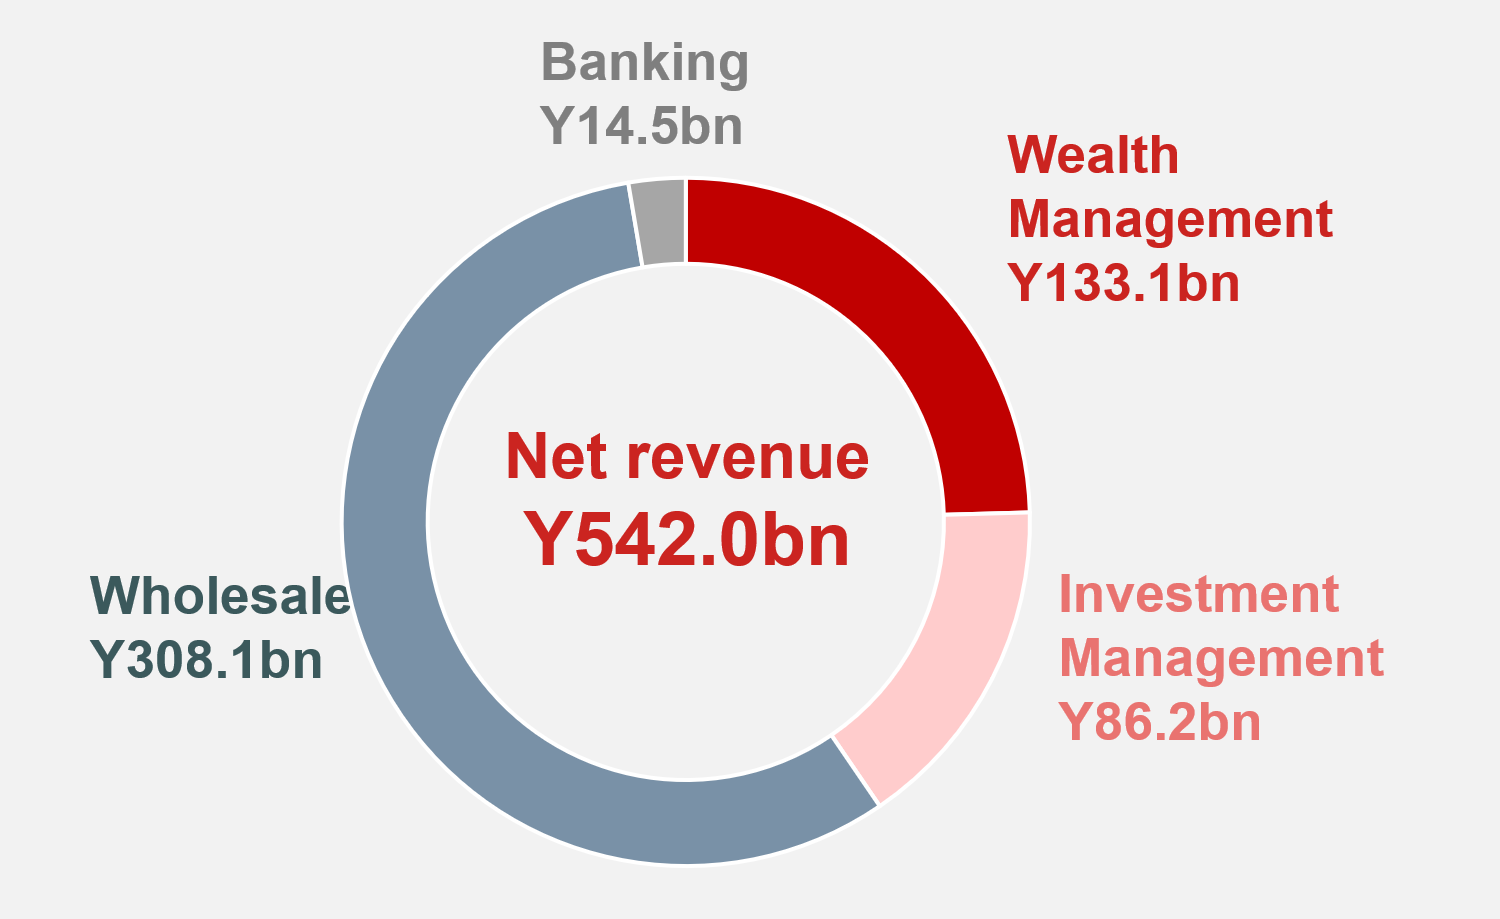
Breakdown of FY2025/26 4Q net revenue
Four-segment income before income taxes came to Y125.6bn. We saw steady progress in our efforts to make our companywide earnings more reliably stable, with solid business performance and a continued accumulation of stable sources of revenue.
Earnings in Wealth Management in 4Q came in higher than the already strong levels recorded in 3Q.
|
- Income before income taxes, at Y61.2bn, was higher even than the high level recorded in 3Q.
- The net increase in recurring revenue assets1 was strong again at Y422.8bn, marking a 16th straight quarter of strong net growth. That steady accumulation of recurring revenue assets helped lift recurring revenue to a fresh record high.
- The recurring revenue cost coverage ratio2 for the past four quarters rose to 72%, powered by growth in net revenue.
1. Recurring revenue assets: Assets including investment trusts, discretionary investments, insurance, loans, and level fees that yield revenue (recurring revenue: revenue arising from asset balances or revenue that arises regularly)
2. Recurring revenue divided by non-interest expenses using four-quarter cumulative
Net revenue reached a record high on growth in existing businesses and the contribution of acquired businesses.
|
- Assets under management and business revenue both rose to record highs by way of growth in existing business and the expansion of overseas operations through acquisitions.
- However, the division’s income before income taxes was essentially flat QoQ, owing to costs related to acquired businesses and the booking of an impairment loss on our equity stake in an investee company.
Within Wholesale, Global Markets saw a QoQ decline in net revenue, although earnings in the Equities business rose to a record high3. Momentum in investment banking remained solid, buoyed by performance in Japan.
|
- Although net revenue in Global Markets overall declined QoQ, the Equities business recorded record-high earnings, led by Equity Products.
- In Investment Banking, net revenue held at a high level despite a QoQ decline. Business has been on a solid trajectory, with the division involved in a diverse array of M&A deals and multiple large-scale financing deals. In both M&A and financing, Nomura has maintained a dominant share in the Japan-related league tables.
- Diversification across regions and product lines is helping to broaden the Wholesale’s revenue base.
3. Since FY2016/17, the earliest year for which comparisons are possible
The Banking segment posted solid net revenue but income fell owing to upfront investment in business expansion.
|
- Account openings and loan executions rose along with the profile of the loan business. The investment trust business also grew on the establishment of new trusts, thereby helping to ensure steady expansion of the business platform.
- However, income before income taxes fell on higher expenses due to IT investments associated with the standardization of business processes and the recording of taxes and public dues. This constitutes upfront investment designed to ensure future growth.
Access press releases and financial results below.
-
What are the main takeaways from FY2025/26 results at Nomura Holdings?
Full-year net revenue totaled Y2,167.7bn, income before income taxes totaled Y539.8bn, net income totaled Y362.1bn, and ROE came in at 10.1%, thereby meeting the quantitative target of 8–10%+ in our 2030 Vision for the second year in a row. Solid performance also enabled us to provide shareholder returns via dividends while striking a balance with growth investment.
-
How high is the annual dividend?
The FY2025/26 yearend dividend is Y24 per share, yielding an annual dividend of Y51 per share (the interim dividend was Y27 per share).
-
Will there be a share buyback for 4Q FY2025/26?
We have not decided on any share buybacks as of the announcement of these results. We will continue to consider shareholder returns including share buybacks, while striking a balance with growth investment and the health of the balance sheet.
-
How high was ROE for Full-Year FY2025/26?
ROE came in at 10.1% in FY2025/26.
-
Which segments performed well?
Wealth Management saw a further uptick in recurring business that generates stable revenue in FY2025/26, while Wholesale saw record revenue both for the segment as a whole, and also for both the Global Markets and Investment Banking. These two segments generated record income before income taxes, thereby driving overall performance.
-
What is ROE?
ROE stands for Return on Equity. It indicates how efficiently a company generates profit relative to shareholders’ equity. ROE is calculated by net income attributable to Nomura Holdings shareholders.
-
What is EPS?
EPS is an indicator of earnings per share, showing how much profit was generated per share.
At Nomura Holdings, it is calculated as diluted net income attributable to Nomura Holdings’ shareholders per share.
Formula: EPS = net income attributable to Nomura Holdings shareholders ÷ the average number of shares outstanding adjusted for dilution.
Nomura Holdings IR Department
+81(3)5255-1000
- Source: "Consolidated Results of Operations Fourth quarter, year ended March 2026" (PDF)
- URL: https://www.nomuraholdings.com/en/investor/summary/finance/main/011111111113/teaserItems5/0/linkList/0/link/2026_full_prem.pdf
- This draft is a summarized version of the above-mentioned PDF. Definitions (EPS calculation method, ROE annualization method, etc.) follow those in the PDF document.
- Date published: April 27, 2026
- Accounting periods:
- Full-Year 2026 (April 1, 2025 through March 31, 2026)
- FY2026 4Q (January 1, 2026 through March 31, 2026)