


We present here key points from FY2025/26 3Q (1 October 2025 – 31 December 2025) consolidated earnings for Nomura Holdings.
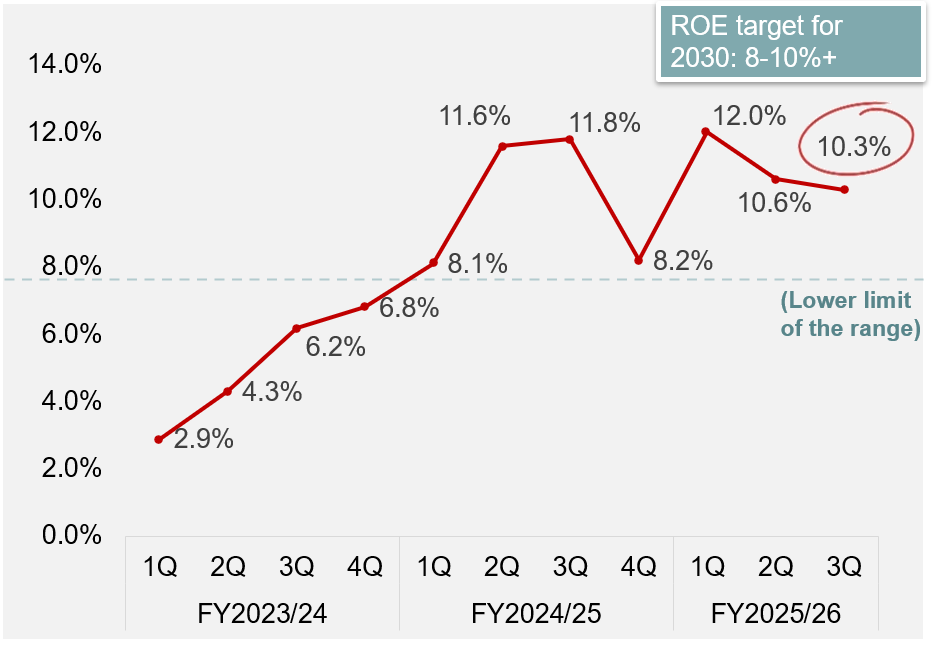
Nomura Holdings’ 2025/26 3Q income before income taxes came to Y135.2bn (down 1% QoQ) and ROE was 10.3%, reaching the quantitative target for 2030 of at least 8 to 10% for the seventh consecutive quarter.
The share buyback of up to Y60.0bn worth of shares was resolved for the purpose of returning profits to shareholders and improving capital efficiency in view of solid earnings momentum.
- FY2025/26 3Q
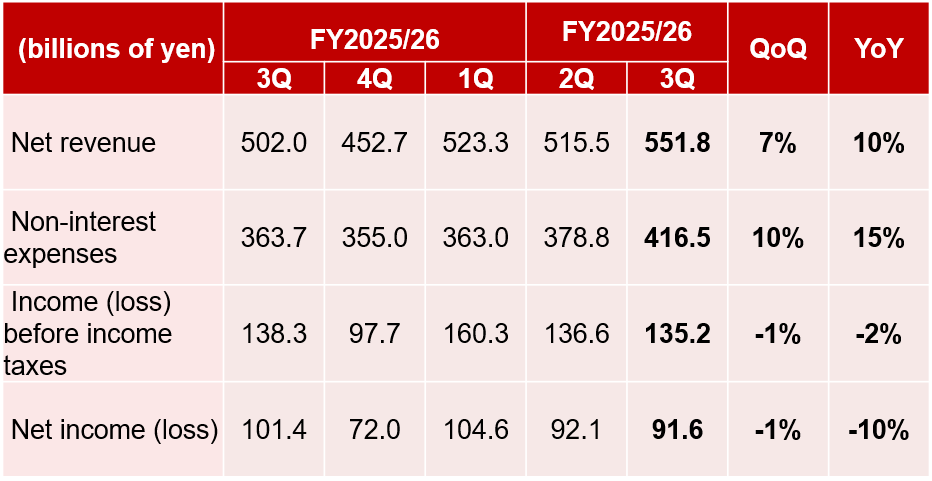
- Net revenue:Y551.8bn(+7%, QoQ)
- Income before income taxes: Y1,35.2bn(-1%, QoQ)
- Net income: Y91.6bn(-1%, QoQ)
- EPS(3Q): Y30.19
- ROE: 10.3% — target attained for seven straight quarter
- Other
- Income before income taxes at the four main segments: Y142.9bn (+8% QoQ), the highest level in eighteen and a half years
- Shares repurchase resolution: Up to 100mn shares for up to Y60.0bn, to be carried out between 17th of February and 30th of September 2026
Refer to the FAQ for definitions of indicators.
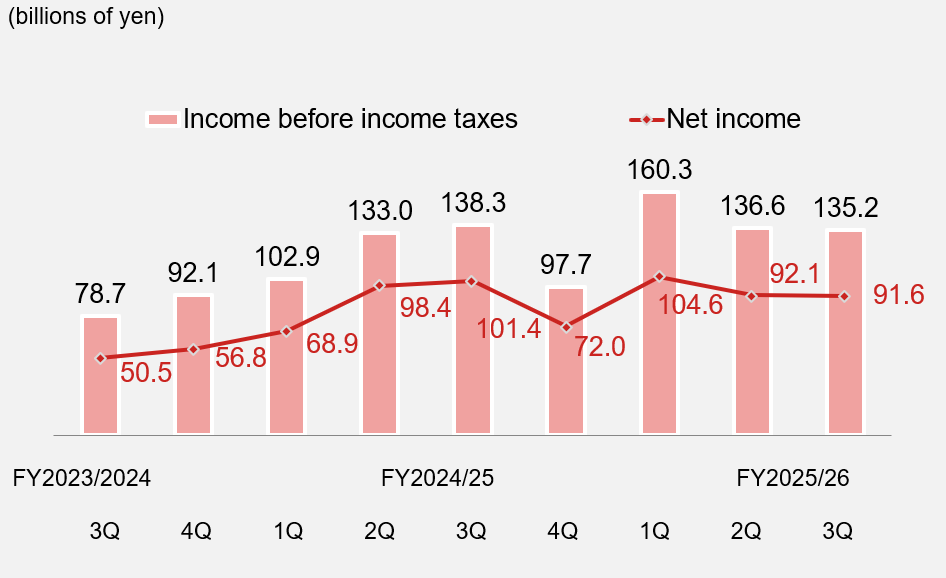
- Groupwide net revenue for 3Q came to Y551.8bn (up 7% QoQ), income before income taxes came to Y135.2bn (down 1%), and net income came to Y91.6bn (down 1%).
- EPS for the quarter came to Y30.19, and ROE came to 10.3%. ROE achieved our 2030 target of 8% to 10% or higher for the seventh consecutive quarter.
- Performance was solid across all four main business segments, although the segment “other” recorded a loss due to worsened market conditions in the digital asset business.
We have successfully been laying the foundations for future growth, increasing our base of steady revenue through the accumulation of recurring business. Growth in companywide earnings was powered by continued growth in revenue and profits in the Wealth Management division and the Wholesale division.
Income before income taxes, and net income
ROE by quarter
2030 ROE target achieved over seven consecutive quarters
FY2025/26 3Q: Overview of results
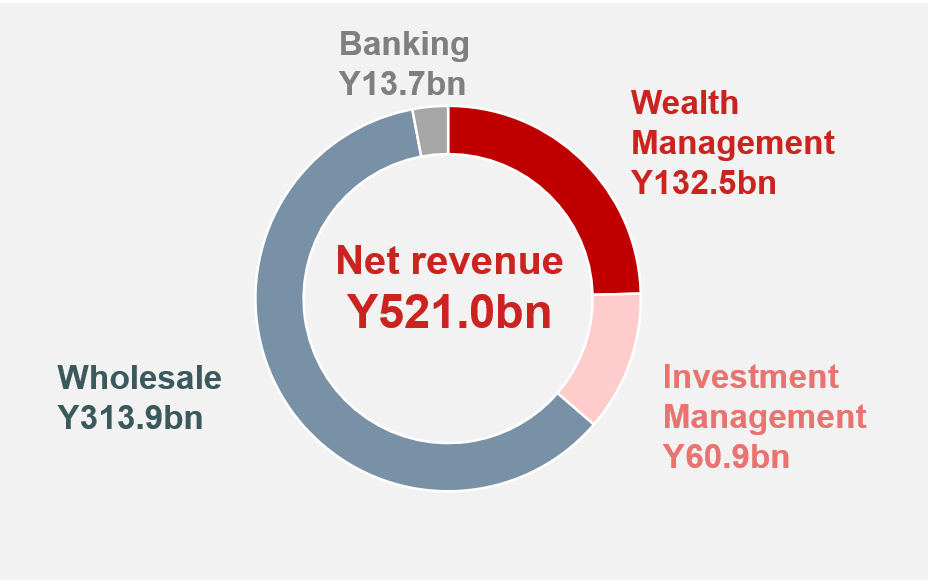
Breakdown of FY2025/26 3Q net revenue
Wealth Management
- Income before income taxes rose by roughly 30% over the previous quarter’s level, which was already quite high. The pretax margin, at over 40%, was higher than the industry average.
- The net inflow of recurring revenue assets1 reached an all-time high of Y503.9bn. This was the 15th consecutive quarter with a net inflow, achieved even while meeting requests for redemptions as major markets rose to record highs. Recurring revenue assets and recurring revenue both climbed to new record highs.
- Ongoing cost controls helped lift the recurring revenue cost coverage ratio2 for the past four quarters to 71%, adding further stability to our earnings performance.
(For more, see slides 7–9 of our presentation materials)
1. Recurring revenue assets: Assets including investment trusts, discretionary investments, insurance, loans, and level fees that yield revenue (recurring revenue: revenue arising from asset balances or revenue that arises regularly)
2. Recurring revenue divided by non-interest expenses using four-quarter cumulative
Investment Management
- Performance in the Asset Management business remained strong. Business revenue—representing stable revenue sources—rose to an all-time high of Y57.8bn.
- Assets under management rose to Y134.7trn through a combination of growth in the existing business and the completion of the acquisition of the public asset management business of Macquarie Group. Asset management fees collected also rose to an all-time high.
- While 3Q income fell on cost increases due to expenses attributable to acquired businesses, amortization of intangible assets, and one-time acquisition-related costs, we continued to make progress in building out a base for stable revenues.
(For more, see slides 10–11 of our presentation materials)
Wholesale
- We maintained the strong performance trend of the previous quarter, with revenue and profit both up. Revenue was driven by strong momentum in Japan and the Americas in particular.
- In Global Markets, revenue in Equities rose to a record high3. In Equity Products, revenue growth was strong in the Americas, where increased client activity drove strength in Derivatives; and in Execution Services, revenue growth in Japan was robust, partly driven by primary deals.
- Investment Banking net revenue reached an all-time quarterly high3. Equity Capital Markets (ECM) revenue grew, benefiting from multiple major IPO and POs, most notably in Japan. Debt Capital Markets (DCM) performance (bond underwriting) remained strong in Japan.
(For more, see slides 12–14 of our presentation materials)
3. A record quarter since comparisons possible in FY2016/17
Banking
- Performance remained solid, with steady growth in loans outstanding, the investment trust balance, and AUM thanks to our advertising strategy and sales efforts.
- Preparations for the deposit sweep service scheduled for introduction in FY2026/27 are progressing as planned.
(For more, see slide 15 of our presentation materials)
- Number of shares: 100 million shares (MAX)
- Value: Y60bn (MAX)
- Period: 17th of February, 2026 – 30th of September
Related Press Releases
- Nomura Reports Third Quarter Financial Results
- Financial Summary–Nine months ended December 31, 2025
- Nomura Approves Share Buyback Program
- Nomura to Cancel Own Shares
Related Links
- Financial results: Financial Results | Quarterly Earnings | Financials | Investor Relations | NOMURA
- Business Strategy: Presentations | Investor Relations | NOMURA
-
What is “net income”?
“Net income” refers to net income attributable to Nomura Holdings shareholders (consolidated basis).
*Please refer to the notes on page 2 of “Consolidated Results of Operations: Third quarter, year ending March 2026”. -
What is the definition of EPS (earnings per share)?
EPS is diluted net income (loss) attributable to Nomura Holdings shareholders per share. The denominator is the number of shares outstanding adjusted for factors that could result in dilution. Formula: EPS = net income attributable to Nomura Holdings shareholders ÷ the average number of shares outstanding adjusted for dilution.
*Please refer to the notes on page 2 of “Consolidated Results of Operations: Third quarter, year ending March 2026”.
-
How is ROE (return on equity) calculated?
ROE is calculated by annualizing net income attributable to Nomura Holdings shareholders for each period.
*Please refer to the notes on page 2 of “Consolidated Results of Operations: Third quarter, year ending March 2026”. -
What is meant by the “four main segments”?
The “four main segments” is a reference to our four main business segments, which are Wealth Management, Investment Management, Wholesale, and Banking.
Make direct inquiries to:
Nomura Holdings IR Department +81(3)5255-1000
References/Notes
- Source: "Consolidated Results of Operations Third quarter, year ending March 2026" (PDF)
- URL: https://www.nomuraholdings.com/en/investor/summary/finance/main/011111111114/teaserItems4/0/linkList/0/link/2026_3q_pres.pdf
- *Relevant pages are page 2 (notes: definitions) and pages 7-15 (comments on segments
- This draft is a summarized version of the above-mentioned PDF. Definitions (EPS calculation method, ROE annualization method, etc.) follow those in the PDF document.
- Citations and references must follow these conditions: When quoting or referencing, please be sure to cite the following sources:
- Source (i.e., Nomura Holdings “Consolidated Results of Operations: Third quarter, year ending March 2026”)
- This page (Created (posted) on January 30, 2026)
- Full URL for above-mentioned PDF (i.e., “Source: Nomura Holdings (January 30, 2026), ‘Consolidated Results of Operations: Third quarter, year ending March 2026’ (URL)”
- Accounting period: October 1, 2025, through December 31, 2025